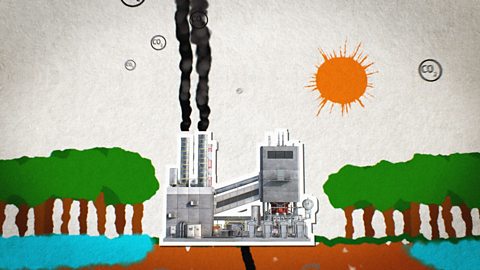
What are the key terms in fieldwork and competition?
Biodiversity: a measure of the number of different species living in an area.
Population: the number of organisms of the same species living in an area.
Habitat: where a population lives.
Environment: an organism’s surroundings. It contains factors that influence the organism. These factors can be divided into abiotic and biotic factors.
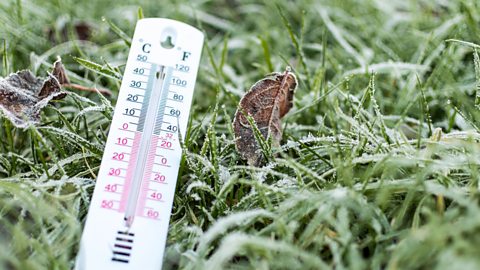
Physical rather than biological; not derived from living organisms. non-living factors - eg temperature.
Living or once living components of a community; for example organisms, such as animals and plants.: living factors - eg a predator.
Community: several populations of different species living in habitats close together.
Ecosystem: an area where a community of organisms live and are affected by a range of environmental factors.
Sampling
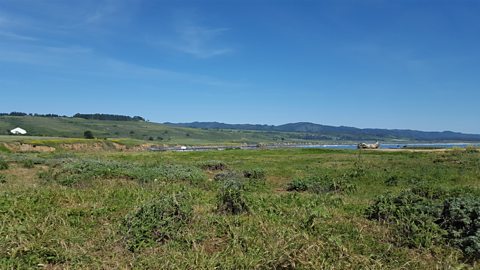
The distribution of organisms in a habitat can be affected by abiotic factors such as temperature and light. Counting all organisms in a large area is often difficult due to time limits and because animals may hide. To address this, small sections within the larger area are sampled.
Effective sampling should be:
reliable, a large sample size is needed – 20 to 30 quadrats counted.
representative of the habitat being investigated. Quadrats should be placed randomly to produce valid results and avoid bias.
Prescribed Practical B4 - Use quadrats to investigate a habitat
Quadrats are a small square frame that can be used to investigate the abundance of plants and Animals that lack the ability to move from one place to another independently, and are typically permanently attached to a substrate. animals in a habitat.
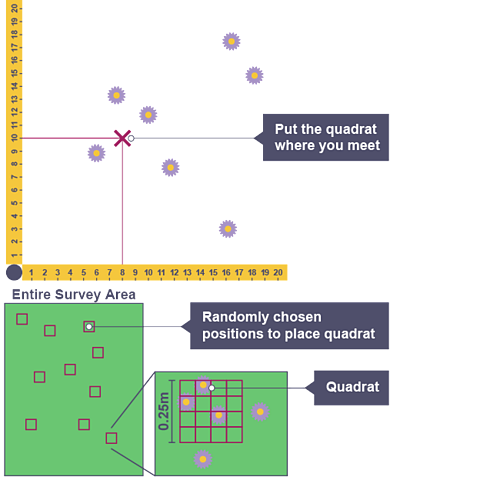
Quadrat - random sampling
Procedure
- Place two measuring tapes at right angles to create a co-ordinate grid.
- Use a random number generator to make random coordinates.
- Place a quadrat at each coordinate.
- Use a key to identify unknown species.
- Count the numbers of each species in each quadrat.
- Record results in a table.
- Calculate the average of each species per quadrat.
- Multiply the average by the total area to estimate the population size of each species in the habitat.
Quadrat - belt transect
The belt transect is used to study changes across a habitat.
Procedure
- Place a measuring tape (10m) across the habitat.
- Place a quadrat at regular intervals (eg every 1 m) along the transect line.
- Count the numbers of each species.
- Record results in a table.
- Repeat step 2-4 to get reliable results.
- Calculate the average number of each species at each interval.
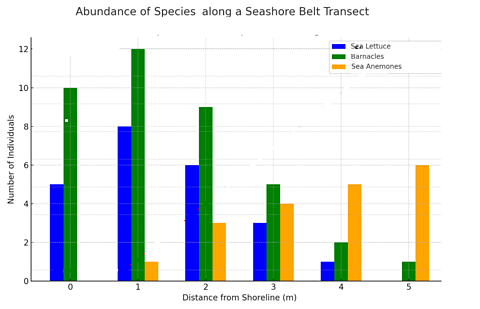
- Plot results on a bar graph.
Results
| Distance from shoreline (m) | Sea lettuce | Barnacles | Sea anemones |
|---|---|---|---|
| 0 | 5 | 10 | 0 |
| 1 | 8 | 12 | 1 |
| 2 | 6 | 9 | 3 |
| 3 | 3 | 5 | 4 |
| 4 | 1 | 2 | 5 |
| 5 | 0 | 1 | 11 |
Conclusion:
The number of sea lettuce and barnacles decrease with increasing distance from the shoreline whereas the number of sea anemones increase because there are different conditions at various distances from the shore.
Environmental factors
Abiotic (non-living) factors
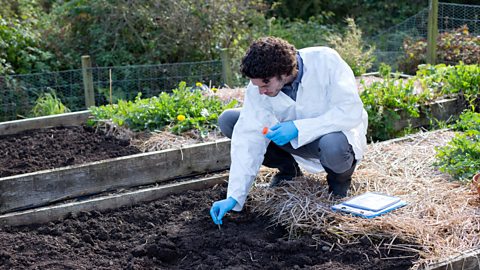
An organism’s surroundings (abiotic and biotic factors) can influence its distribution.
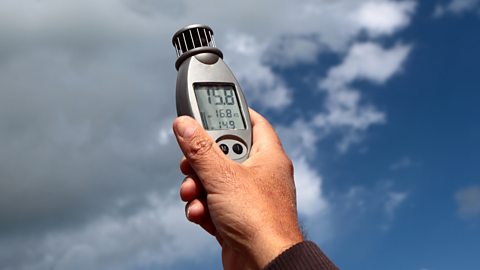
Image caption, Wind speed is measured with an anemometer. It affects the rate of water loss by plants and therefore affects their survival rates in exposed areas.
1 of 5
Biotic (living) factors
Other plants and animals can affect the distribution of an organism.
Biotic factors, like predation and competition, strongly influence species distribution. For example, high predator numbers can reduce prey populations, while limited food resources can heighten competition and impact survival.
Biotic factors are much more difficult to measure than abiotic.
Competition
Competition between animals is usually for:
food
water
territory
mates
Competition between plants is usually for:
light
water
minerals
space
Competition for these resources can affect population growth. Organisms adapt to their individual environments and to any competition for resources.
Human effect on the ecosystem
Humans can also influence the normal balance of an ecosystem.
Humans disrupt ecosystem balance through activities such as
deforestation
pollution
overfishing
climate change
These actions alter habitats, reduce biodiversity, and destabilise food webs, impacting the health and endangering species.
Hello. I’m Dr Alex Lathbridge and this is Bitesize Biology.
This is the second episode in a series on Ecology. Today, we’re going to talk about the resources that plants and animals compete for and the adaptations that they’ve developed. I’ll also be looking at abiotic and biotic factors, the non-living and living parts of an ecosystem that can change.
If you haven’t listened to the last episode on the organization of ecosystems, I think you should, otherwise there are lots of terms that you might not understand.
But let’s quickly remind ourselves of a few key ecology terms:
A population is all the members of a single species.
A community is two or more populations of different species.
An ecosystem is the interaction between a community of living things and the environment.
Ecosystems are all about competition. Organisms need specific resources from their environment, and there is not an infinite amount for everyone. Grab a pen and write this down:
Plants need light and a regular water supply for photosynthesis to happen, as well as space for healthy growth.
All animals need food.
But animals within the same species also compete for mates. Some deer engage in physical fights locking antlers in order to win mates, also, if you haven’t seen giraffes fighting one another just using their necks it is terrifyingly fascinating. Look it up.
Animals also compete for territory. Territories contain all the resources and conditions they need to survive.
So how are animals able to compete like this?
Yes, you’ve guessed it. They’ve developed adaptations that make them better suited to their environment, so they have a higher chance of survival and successfully breeding.
The adaptations that arise from competition are due to the process of evolution that we discussed on previous series.
Adaptations can be structural, behavioural or physiological – let’s start with plants:
In plants, structural adaptations are physical features like spines found on cacti that stop them being eaten or bright flowers which attract insects to pollinate them.
Behavioural adaptations of plants are behaviours which give them an advantage like growing up quickly towards light, to maximise photosynthesis, or plant roots growing downwards to take up more water.
Physiological adaptations of plants are processes like the formation of poisons for defence, found in nettle stings and deadly nightshade.
But what about in animals?
Structural adaptations of animals are physical features such as sharp claws that can catch prey or dig burrows. Predators and prey often have similar adaptations – for instance, both might have good vision and good hearing.
Behavioural adaptations of animals are behaviours such as mating rituals, like a male peacock showing his tail to attract a female. Many bird species migrate to warmer areas in winter times to avoid the cold.
Physiological adaptations of animals are processes like the production of venom in snakes and spiders, which can help them to defend themselves and kill their prey. Or dogs – like my baby boy Ollie – can have amazing sensitivity for detecting movement with their eyes, a trait that is useful for hunting and guarding.
But not all environments are the same.
An organism that lives in an extreme environment is known as an extremophile.
These organisms live in extreme environments such as frozen polar regions, the driest deserts, high pressure in the deep ocean and super-hot thermal vents or volcanoes. Usually these are microorganisms like bacteria.
Extremophiles have a few highly specialised adaptations that help them to survive in the extreme environments. Very few other organisms would be able to survive in there.
So now we’ve understood what organisms compete over, and the adaptations they’ve developed, the final section of this episode is about abiotic and biotic factors. These are factors within an ecosystem that can affect he abundance and distribution of living organisms. The names sound complicated but honestly, it’s really not. They literally meaning “non-living” and “living.”
Let’s start with abiotic factors, the non-living elements in an ecosystem that change.
You need to be aware of these in case they pop up in your exam, grab a pen so you can write this down:
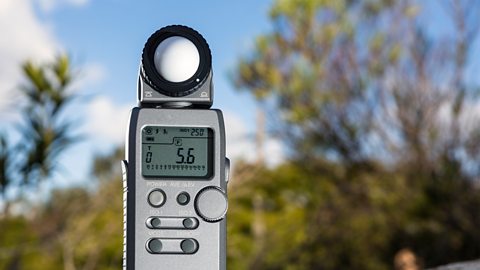
Light intensity – some plants might need shade, some might prefer bright light.
Temperature - plants and animals might prefer hot or cold areas. Polar bears have evolved to live in the cold North Pole and would not survive elsewhere, like a desert.
Moisture Levels – plants cannot survive in soils that are too waterlogged, as their roots cannot respire.
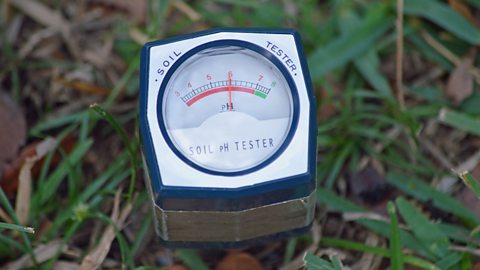
Soil pH level - different plants prefer acidic or alkaline soils.
Soil minerals – many plants need high levels of minerals in their soil for growth.
Wind intensity and direction affects the distribution of organisms (where they live in a habitat).
Many prefer locations that are sheltered away from strong wind.
Carbon dioxide levels affect plants, as they need carbon dioxide for photosynthesis.
Oxygen levels affect aquatic animals (animals that live in water). Oxygen is essential for aquatic animals to survive; they would suffocate otherwise. Polluted waters often have low levels of oxygen.
An increase or decrease in an abiotic factor can have a huge impact on a species population size within a community. Remember, many organisms are interdependent, and so multiple organisms can be affected by a change in abiotic factors.
Just because a rabbit might not care about moisture levels, doesn’t mean the grass they eat is the same way. Remember animals depend on plants for food, so a lower number of a plant species could affect an animal species in a community.
Let’s look at some biotic factors now, these also affect the abundance and distribution of organisms in an ecosystem, but they are living things.
You going to need to know four biotic factors: availability of food, new predators, new pathogens and competition.
Availability of food is a major factor in how many animals live in an ecosystem. Rainforests have lots of varied food sources and so have a wider variety of species living there. Areas like deserts where there is less food have fewer species.
New predators can have a devastating impact on ecosystems. They can upset the balance of predator-prey cycles and cause a big decrease in the numbers of prey, which in turn reduces the food for existing predators, so they’re affected too.
New Pathogens. We talked about pathogens in our series on Infection. When organisms move to new habitats, they often bring with them new pathogens, like viruses that the existing organisms in the habitat aren’t immune to.
Finally let’s not forget competition. We’ve already talked about how many resources plants and animals compete over. The introduction of a new species into an ecosystem can result in it overcompeting with an existing species, where the population levels of the existing species become too low to successfully breed and don’t survive.
For example, the Red Squirrel is native to Britain. It has been here for about ten thousand years. But in the 19th century, Grey Squirrels were brought over from America. They’re considered an invasive species. Why?
Red and Grey squirrels eat the same food and live in the same habitats.
Grey Squirrels are larger, can store more fat and survive harsher winters than Red ones.
Grey Squirrels carry a virus called Squirrel pox, that they are immune to, but it can be deadly to Red Squirrels.
So the numbers of Red Squirrels and where they live, reduced dramatically, as they are outcompeted for food by grey ones.
This is why certain countries like Australia are really strict about the things that people can bring into the country from overseas, as changes to the ecosystem could have huge effects.
So organisms can be affected by biotic factors too. Species can decline in numbers if they are outcompeted, or if there’s a new pathogen, or a new predator arriving.
And the same interdependent species are also affected when these things happen. Don’t forget about the knock-on effects.
I’m Dr Alex Lathbridge and this is Bitesize Biology – listen again on BBC Sounds.
Watch a video
OK, so the variety of organisms there are somewhere—the biodiversity—depends on where you are.
But measuring it is easy.
When we measure biodiversity we need to look at two things:
Abundance—how many of a specific species there are and distribution—where they are found.
One common way of measuring biodiversity uses measured areas called quadrats.
The quadrat I'm using has an area of 1 metre squared.
So, step 1—choose a species to investigate. And I'm going to count…
No guys. It doesn't work with running-away species, like cats.
It has to be limited to plants, or slow-moving creatures… so, snails. That works, thanks.
But even when I've limited it to just one thing to count, I can't possibly study every inch of the field,
so let's imagine the whole space as a grid.
If I sample 10% of it, and then times my result by 10, that's a reasonable estimate of abundance.
But what if I think this side of the field looks nicer?
Or maybe I'm feeling lazy and I don't want to walk too far?
There's a danger I only take samples from one part of the grid, which isn't representative of the whole area.
This is why it's important the quadrats are placed randomly within the grid.
For this, we use a random number generator.
I also need to consider the species distribution and identify what factors might affect it.
Those factors could be biotic—caused by other organisms.
For example, I'm not likely to find a whole load of lettuce plants near a rabbit warren.
Or they could be abiotic—caused by environmental factors such as soil, altitude, sunlight or wind.
So here, I can see a fairly obvious abiotic factor—it's wet over there.
Will that affect the distribution of my species?
Well, just taking random samples won't tell me that.
Instead I need to use a transect line.
Sounds fancy, but in fact it's just a line made with tape or rope.
I put my quadrats along this transect line, running from the wettest part through to the driest.
I then have to make a decision—how often am I going to take a sample?
Now, samples need to be regular. So let's say every 3 metres.
Right, now we can ask, does this abiotic factor, the wetness of the ground, influence snail distribution?
If it does, when I analyse the data, I should be able to see a clear pattern.
To get a measure of overall abundance of a given species…
…we calculate the mean number of organisms in a given area.
The mean is the total number of specimens found in the quadrats, divided by the number of quadrats taken.
My quadrat had an area of 1 metre squared so this gives me the number of specimens per square metre.
The median is the number in the middle of the range of results.
So the median number of snails is 6.5 per metre squared.
You can also work out the mode—the most frequently occurring value.
In this case, 7 snails per metre squared.
A proper biodiversity study is painstaking business.
I've done all this work and I've only got data on snails…
But of course I could repeat the same techniques, to build up a full picture of the biodiversity of this field.
It'd just take a long time—that's science!
Test your knowledge
More on Biodiversity
Find out more by working through a topic
- count2 of 4

- count3 of 4