Key facts on photosynthesis and plants
Photosynthesis is an endothermic process in chloroplasts where light energy is used to convert carbon dioxide and water into glucose and oxygen.
Plants use glucose for respiration and store it as starch or oils, forming the basis of energy flow through food chains.
Experiments show that light and chlorophyll are essential for photosynthesis, and the rate can be measured by oxygen production.
Environmental factors and competition affect plant growth and distribution, while human activity can both harm and protect biodiversity.
What is photosynthesis?
Photosynthesis is an When energy is taken in from the surroundings, this is called an endothermic reaction and usually feel cold. process that takes place in the chloroplasts (found in leaf cells).
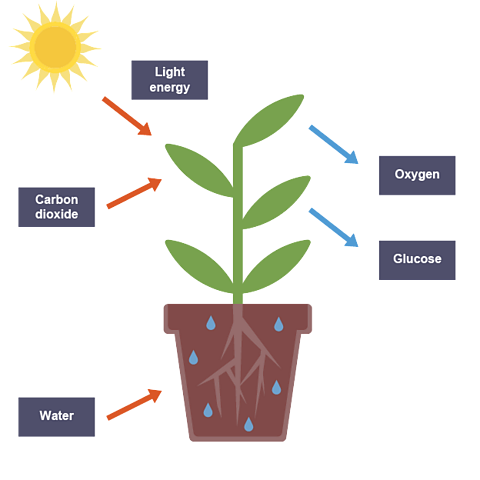
Chloroplasts have a green pigment called chlorophyll, which absorbs light energy that reacts carbon dioxide and water together producing glucose (chemical energy) and oxygen.
Photosynthesis word equation
carbon dioxide + water -> glucose + oxygen
Photosynthesis balanced chemical equation
6CO2 + 6H2O -> C6H12O6 + 6O2
The plant uses the glucose it produces for:
Respiration – to provide energy.
Storage – glucose is converted into starch and oils.
Watch: What is the rate of photosynthesis?
Plants are primary producers – they don't need to take food from any other creatures; they sort themselves out. All they need is water, light, and carbon dioxide, which is in the air all around them. If they can get those three things, they do something amazing – they make glucose, or sugar, which is the main energy source for pretty much all living creatures.
Plants carry out a chemical reaction called photosynthesis, which happens in the chloroplasts of the leaves. The chloroplasts contain a green pigment called chlorophyll, and that enables an endothermic reaction. It transfers energy from light to catalyse the reaction between carbon dioxide and water, and that makes glucose plus oxygen.
How fast a plant can grow depends on how fast it can photosynthesise. In a plant's ideal world, there would be unlimited supplies of carbon dioxide, water, and sunlight, and the temperature would always be in the optimum range. But in reality, at least one of these things is usually in short supply. It’s what we call a limiting factor, and that's something we can test in the laboratory.
For example, we might ask the question: which factor is going to limit growth the most? Not enough light, not enough carbon dioxide, or low temperature? To find out, we're going to have to measure the rate of photosynthesis. But how can we do that? We can't actually see it because it happens on such a small scale.
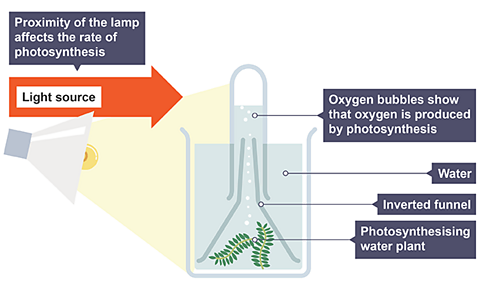
However, when photosynthesis is happening, oxygen is being produced as a by-product. The leaf gets rid of most of the oxygen, and that we can observe. A great thing to use is pondweed, because the oxygen it gives off forms bubbles in the water. We can count the bubbles to give an average rate per minute, or the gas can be captured and the volume measured.
If we set up an experiment to investigate how changing light intensity affects the rate of photosynthesis, it's really important to know that any difference is caused by the variable that we're trying to test, and not by a difference in another variable. If we're testing light intensity, we need to keep carbon dioxide concentration and temperature the same. The only thing we want to change is the intensity of the light.
The simplest thing is to move the light source, but make sure the water temperature doesn’t change as we move the light. The number of bubbles formed, which we're using to measure the rate of photosynthesis, slows down as we move the light further away. The results can be plotted on a graph like this.
But here's something to consider: as the light moves further from the plant, the light intensity decreases, yes, but not in a straightforward, linear way. We can calculate the light intensity using the inverse square law. Light intensity is proportional to one over distance squared.
To complete the experiment, we also want to test the other variables. Again, we need to ensure we only change the variable we're investigating. Counting pondweed bubbles might not be the most exciting thing ever, but seeing as photosynthesis is the basis of all multicellular life on Earth, it's pretty neat to be measuring just what drove our success.
Testing a leaf for starch
- Boil the leaf in water – this kills it, stopping any further chemical reactions.
- Boil the leaf in ethanol – removes the chlorophyll making the leaf turn white.
- Turn off Bunsen burner – safely as ethanol is flammable.
- Dip the leaf in water – this softens it.
- Spread the leaf onto a white tile and add iodine to test for the presence of starch.
Results:
| Starch | Colour change with iodine |
|---|---|
| Present | yellow-brown to blue-black |
| Absent | remain yellow-brown |
Safety:
As well as wearing goggles throughout the experiment, ensure that the ethanol is not exposed to a naked flame during step 2, as it is highly flammable.
Additional information:
Before carrying out the starch test the plant should be destarched. This is when the plant is placed in the dark for 48 hours to ensure all starch within the plant is used up.
Practical B3: Investigating the need for light in photosynthesis
Method:
- destarch a plant
- cover part of a leaf with lightproof paper/foil
- place the plant in bright light for several hours
- add iodine to test the leaf for starch using the 4-step starch test
- Boil in water - to kill leaf
- Boil in alcohol - to remove chlorophyll
- Dip in water - to soften leaf
- Add iodine - to test for starch
Results
Only the areas that have been exposed to light will photosynthesise and therefore test positive for starch, showing that light is necessary for photosynthesis.
Practical B3: Investigating the need for chlorophyll in photosynthesis
Method:
- destarch a variegated plant – partly green and partly white
- place the plant in bright light for several hours
- test the leaf for starch using the 4-step starch test:
- Boil in water - to kill leaf
- Boil in alcohol - to remove chlorophyll
- Dip in water - to soften leaf
- Add iodine - to test for starch
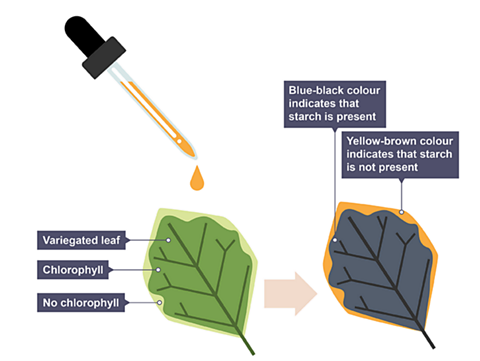
Results
Only the areas that have chlorophyll/are green will photosynthesise and therefore test positive for starch, showing that chlorophyll is necessary for photosynthesis.
Investigating the production of oxygen
Method:
- place pondweed into a beaker of water
- add sodium hydrogen carbonate (gives carbon dioxide)
- cover with funnel and test-tube
- place light at set distance from the plant
- record the number of bubbles produced in one minute
Example of results:
| Distance of light / cm | Number of bubbles |
|---|---|
| 20 | 31 |
| 40 | 30 |
| 60 | 18 |
| 80 | 9 |
| 100 | 2 |
Conclusion:
The closer the light, the greater the rate of photosynthesis as the number of oxygen bubbles increases up to 40cm where the rate is limited by temperature or carbon dioxide concentration.
Photosynthesis Activity
Play this game to see how a seed or a plant is affected by changing how much water, sunlight and carbon dioxide it gets.
What is energy flow?
The Sun is the source of energy for most ecosystems on the Earth.
Plants are producers.
They use light energy absorbed by chlorophyll to make sugars and starches through photosynthesis, which provide food for animals.
Animals, or consumers, get this energy by feeding on plants or other animals.
Herbivores (plant eating animals) are primary consumers.
Carnivores (animals who eat other animals) are secondary consumers, and those eating secondary consumers are tertiary consumers.
Food chains and food webs
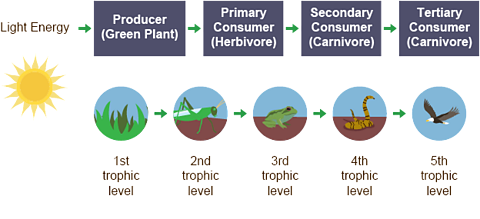
Food chains show the energy flow from producers to consumers.
Each step is called a trophic level:
- producers are on the first trophic level 1,
- primary consumers are 2nd trophic level, and so on.
Specific feeding sequences (and therefore flow of energy) can be represented as a food chain.
Arrows between each organism show the direction of:
- feeding (consumption)
- energy flow
Watch: What is a biodiversity investigation?
OK, so the variety of organisms there are somewhere — the biodiversity — depends on where you are. But measuring it is easy.
When we measure biodiversity, we need to look at two things: abundance — how many of a specific species there are — and distribution — where they are found. One common way of measuring biodiversity uses measured areas called quadrats. The quadrat I'm using has an area of one metre squared.
So step one: choose a species to investigate. And I'm going to count…
No guys, it doesn't work with running-away species like cats. It has to be limited to plants or slow‑moving creatures, so snails. That works, thanks.
But even when I've limited it to just one thing to count, I can't possibly study every inch of the field, so let's imagine the whole space as a grid.If I sample ten percent of it and then times my result by ten, that's a reasonable estimate of abundance.
But what if I think this side of the field looks nicer? Or maybe I'm feeling lazy and I don't want to walk too far? There's a danger I only take samples from one part of the grid, which isn't representative of the whole area. This is why it's important the quadrats are placed randomly within the grid. For this, we use a random number generator.
I also need to consider the species distribution and identify what factors might affect it. Those factors could be biotic — caused by other organisms. For example, I'm not likely to find a whole load of lettuce plants near a rabbit warren. Or they could be abiotic — caused by environmental factors such as soil, altitude, sunlight, or wind.
So here, I can see a fairly obvious abiotic factor — it's wet over there. Will that affect the distribution of my species? Well, just taking random samples won't tell me that. Instead, I need to use a transect line. Sounds fancy, but in fact it's just a line made with tape or rope. I put my quadrats along this transect line, running from the wettest part through to the driest.
I then have to make a decision — how often am I going to take a sample? Now, samples need to be regular, so let's say every three metres.
Right, now we can ask: does this abiotic factor, the wetness of the ground, influence snail distribution? If it does, when I analyse the data, I should be able to see a clear pattern.
To get a measure of overall abundance of a given species, we calculate the mean number of organisms in a given area. The mean is the total number of specimens found in the quadrats divided by the number of quadrats taken. My quadrat had an area of one metre squared, so this gives me the number of specimens per square metre.
The median is the number in the middle of the range of results. So the median number of snails is 6.5 per metre squared.
You can also work out the mode — the most frequently occurring value. In this case, seven snails per metre squared.
A proper biodiversity study is painstaking business. I've done all this work, and I've only got data on snails. But of course I could repeat the same techniques to build up a full picture of the biodiversity of this field. It'd just take a long time — that’s science!
Environmental factors
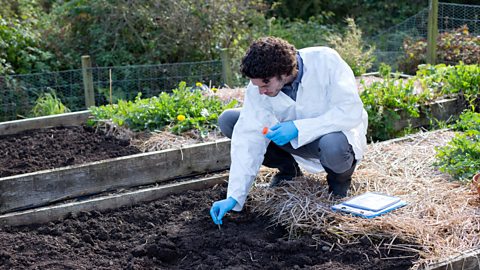
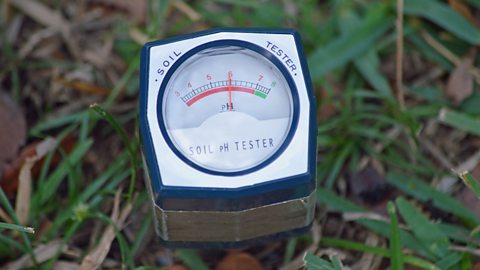
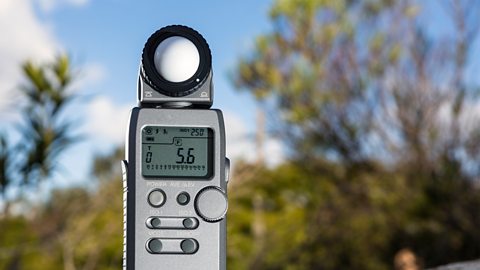
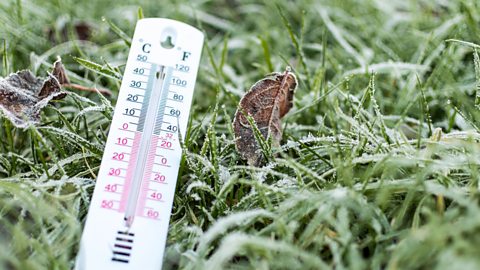
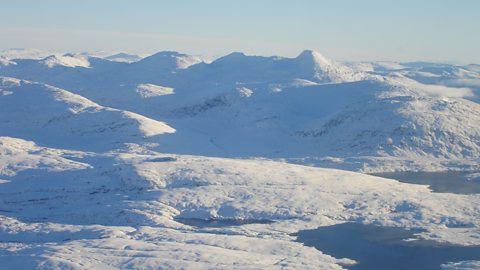
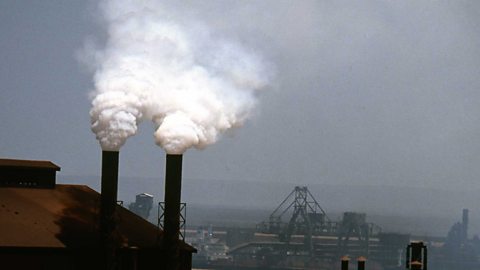
An organism’s surroundings (abiotic and biotic factors) can influence its distribution.
Abiotic (non-living) factors
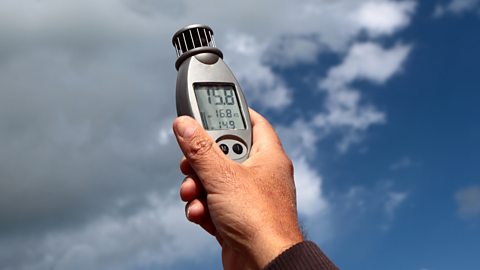
Image caption, Wind speed is measured with an anemometer. It affects the rate of water loss by plants and therefore affects their survival rates in exposed areas.
1 of 7
Biotic (living) factors
Biotic factors are much more difficult to measure than abiotic.
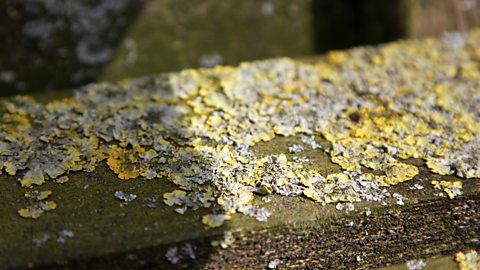
Some species are used as indicator species. For example lichen are only present in non-polluted air and are largely absent in polluted air. Therefore lichen can be used to monitor pollution.
What is competition?
Competition between animals is usually for:
- food
- water
- territory
- mates
Competition between plants is usually for:
- light
- water
- minerals
- space
Competition for these resources can affect population growth.
Competition affecting organism populations
Red and grey squirrels
The grey squirrel is not native to the UK - it was introduced from North America.
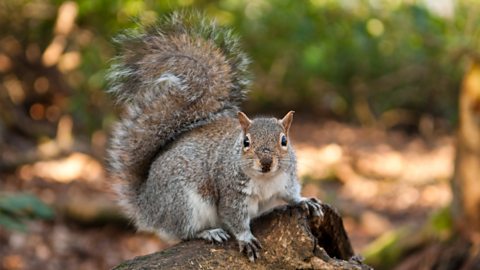
There is great competition between the red and grey squirrel with the population of the grey outweighing that of the red in some areas.
This has happened for a number of reasons.
The grey squirrel eats a wider range of food and can survive in areas of mixed woodland whilst the red squirrel cannot.
The grey squirrel carries a disease that is fatal to red squirrels while the grey remains unaffected.
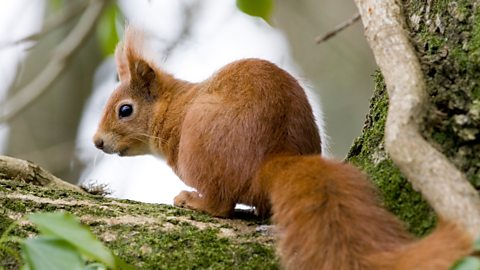
However, grey squirrels are much larger than red squirrels and need more food to survive.
In areas where seeds are small (eg conifer forests) the grey squirrel struggles to obtain enough food and the red squirrel dominates.
Competitive invasive species
The grey squirrel is an example of a competitive invasive species.
Competitive invasive species:
- are almost always introduced to an area by humans;
- spread rapidly;
- outcompete native species, causing them harm.
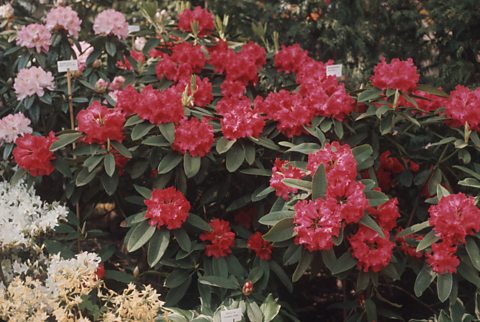
Rhododendron is a competitive invasive plant. It has very dense, evergreen leaves. This prevents other plants growing underneath it.
Competition among plant seedlings
The more seedlings there are in a pot, the smaller the average mass of each seedling.
This is due to the seedlings competing for light, space, minerals and water.
As there is more competition for resources there is less growth.
Human activity and biodiversity
Human activity, such as The cutting down of trees., burning fossil fuels and using excess fertiliser, can have a negative effect on biodiversity.
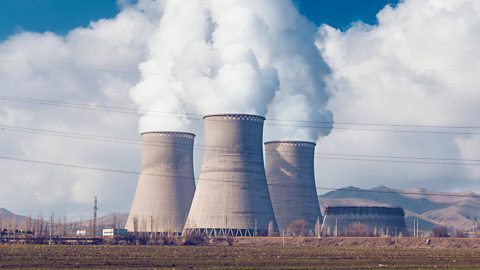
However, other human activities are trying to reverse or slow down these negative effects.
Positive effects
The following table shows ways in which human activity can have positive effects on biodiversity.
| Area of interest | Example |
|---|---|
| Agriculture | Replanting hedgerows - provides habitats for plants and animals. Managing field margins for wildlife - provides habitats for plants and animals. Using fertilisers efficiently - prevents overuse which can cause water pollution. |
| Land use and management | Reclaiming industrial sites - reusing these sites for housing prevents building on greenfields. Using brownfield building sites - reusing these sites for housing prevents building on greenfields. Planting sustainable woodlands - prevents deforestation of native woodland and still provides us with wood. |
| Seas (protecting fish stocks) | Quotas - reduce the number of fish caught. Fishing bans - reduce the number of fish caught. Restrictions on net size - reduce the number of fish caught. However, a larger mesh can also be used. This allows small, young fish to escape and breed. Other strategies used to conserve fish stocks are fish sanctuaries and the decommissioning of boats. |
| Nature reserves | Nature reserves protect rare species and rare habitats. They are also used to educate the public about certain species and nature in general. |
| International treaties | International treaties are designed to combat global pollution. The Kyoto Protocol of 1997 and the Paris Agreement of 2015 are two examples. |