Analysing data
The results obtained from an experiment need to be analysed to understand the findings.
Using the data collected, we can identify relationships between the independent and dependent variables and explain their meaning.
Graphs
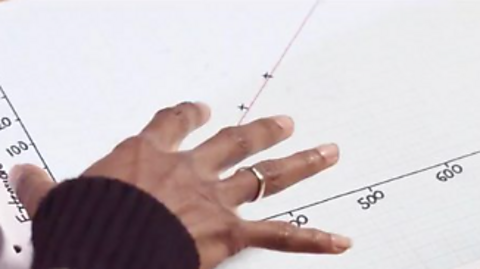
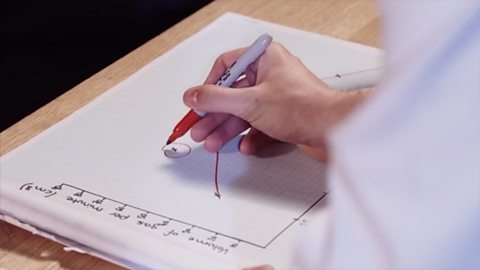
Graphs are drawn to show experimental data obtained during scientific experiments.
It is important to consider the following when drawing a graph:
- The x-axis should be labelled (with the independent variable) and include appropriate units.
- The y-axis should be labelled (with the dependent variable) and include appropriate units.
- A suitable scale should be used that is even and results in the graph taking up at least half of the page.
- The plots should be accurately plotted.
- The plots should be joined with the appropriate straight line, curve or line of best fit.
Identifying Patterns and Trends: Look for relationships between variables and check if the results support the hypothesis.
Checking for Anomalies: Identify any outliers (plots not lying on line of best fit) and assess their cause
Example
Practical 1.4: Investigating the effect of temperature on the action of an enzyme
As temperature increases from 0°C to 40°C, the time taken for starch digestion decreases.
As the temperature increases above 40°C, the time taken for starch digestion increases.
Make deductions from given observations
It is sometimes necessary to record observations during a scientific experiment.
These could include noting any changes during an experiment, recording results in a table or making a drawing.
Example
Practical 1.1 - Make a temporary slide and use a light microscope to examine, draw and identify the structures of a typical plant and animal cell and produce labelled biological drawings
A good biological drawing should be:
- drawn in pencil. Lines should be firm and continuous with no gaps (not sketchy).
- large with the same proportions as the observed cell.
- labelled using separate ruled lines. These should be spread out with a bullet point on one end and a clearly written label on the other.
- given a title that includes its magnification or size.
Watch a video
Watch: Practical skills - Analysing
SHINI SOMARA: Today we are going to be talking about how best to analyse the results of an investigation.
SIMON CLARK: Every scientific investigation needs to have its results carefully analysed so we can work out what we can learn from them.
SHINI: Now, to demonstrate this, we are going to be using a spring experiment, which is used to investigate Hooke’s Law, which states that the extension of a spring is directly proportional to the applied force, as long as you don’t exceed the spring's elastic limit.
SIMON: In other words, the heavier the object that you put on the spring, the further the spring will extend. In fact, the law says that if you double the mass attached you’ll double the extension.
SHINI: So un-extended the spring is 21mm long. And if I add 100gram mass to it the spring extends to 47mm.
Hold on where you going?
SIMON: I thought we could make this a bit more interesting and… bigger. Come on!
SHINI: Wow, when you said bigger you really meant it!
SIMON: Oh Shini, sorry not that big.
SHINI: That still looks like fun though.
But what kind of masses are we going to hang off that giant spring?
SIMON: Our masses are right behind us.
SHINI: So they’re a bit like the 100g mass that we were using in the lab.
SIMON: Exactly just a bit bigger.
First things first though we need a table to record our results in And this is going to help us investigate the relationship between the force applied to the spring and its extension.
SHINI: Perfect!
Now we need to record the length of the spring before and after we apply the masses and then we can calculate the extension of the spring.
SIMON: And we’ve already measured the mass of each object that we are going to be attaching so we can calculate the force we are applying in Newtons.
SHINI: Now we need to make sure that we don’t overdo it with the masses because we don’t want to over extend the spring.
SIMON: Let’s get started.
SHINI: Let’s do it.
SIMON: Well we have our results, now comes the important part.
How can we analyse our results and what can they tell us.
SHINI: Well, let’s take these results back to the lab and look at them in much more detail.
So firstly, we need to fill out the Force column.
And to do that we are going to use the equation F=ma.
SIMON: Where m is our mass and a is the acceleration.
SHINI: So how are you going to calculate acceleration then?
SIMON: Well we actually already know what our acceleration is.
Our acceleration in this experiment is gravity which is pulling the masses down underneath the spring.
And we already know that gravity is always measured at 9.8m/s² so in order to calculate the force associated with our mass, our objects, we just need to multiply this column by 9.8.
SHINI: So as the force is increasing, the extension of the spring is also increasing.
But how precise can we assume our data is given that we only took a single set?
SIMON: Well when making an investigation more accurate, it’s always good practice to get a second set of results.
SHINI: Now we definitely would have done that here in the lab but outside we kind of ran out of time.
SIMON: …and fridges.
SHINI: Anyway let’s fire ahead with analysing the data we’ve got.
SIMON: So to get a better idea of the relationship between our 2 variables, the force and the extension, we need to plot our results.
SHINI: Yeah, so we have two continuous variables and we’re trying to investigate the correlation between those continuous variables.
SIMON: The Force and the extension.
SHINI: Yeah so I reckon we should use a scatter graph and then use a line of best fit to try and see any patterns that might emerge.
SIMON: Okay, agreed! let’s plot this.
SHINI: So our graph shows a directly proportional relationship between our two variables.
SIMON: We can see from the straight line that as the force increases, the extension of the spring also increases.
There’s a predictable relationship between our two variables.
And it also tells us that we haven’t reached the elastic limit of our spring just yet.
SHINI: We can also use this line to predict what the extension of the spring would be for a force that lies between those that we tested outside.
So just to recap on the key points you need to remember when analysing your investigation:
Evaluate the quality of your findings, deciding on whether you’ll need to repeat anything.
Present your data and results in the most appropriate way – in our investigation we used a table to gather the data and then we selected the best type of graph to analyse our findings.
SIMON: Analyse your data using the most appropriate techniques. In our investigation this was a scatter graph.
And then after your analysis you might want to rethink how you present your data before going on to identify patterns and trends.
If you follow these steps, then you won’t go too far wrong.
SHINI: Except for I think I went wrong. I wore thin socks.
SIMON: Oh I was so so cold. It was freezing out there.
Test your knowledge
More on Practical skills
Find out more by working through a topic
- count4 of 4
- count1 of 4

- count2 of 4